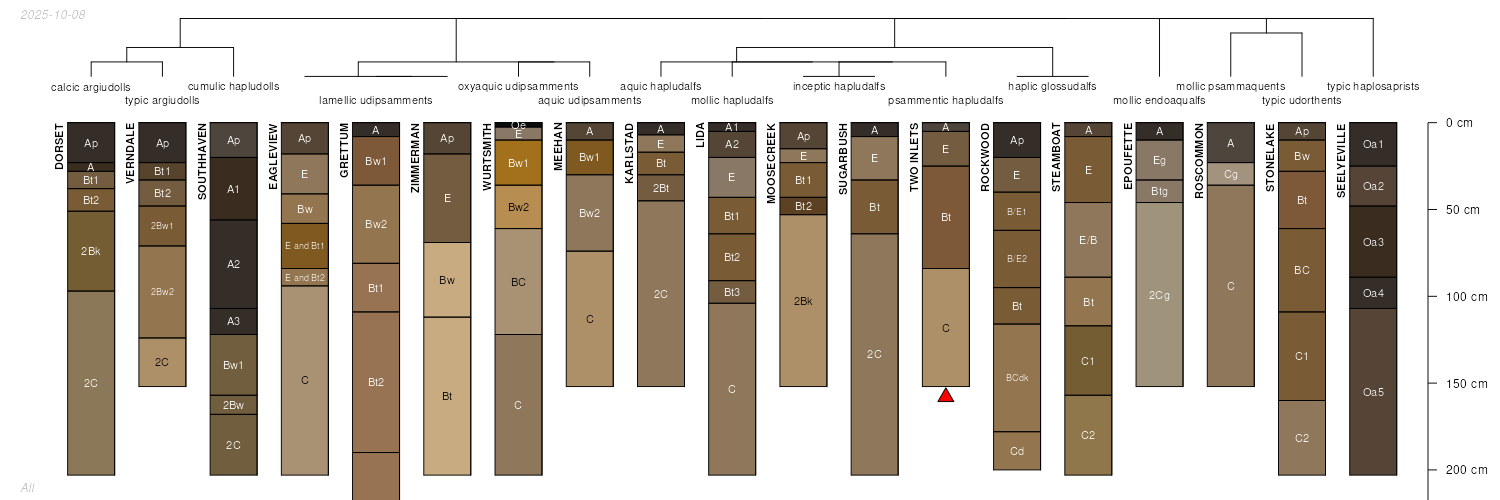
| Sugarbush-Two Inlets complex, 3 to 15 percent slopes | 775C | 20892 | 397561 | 2x14t | mn005 | 1994 | 1:20000 |
Sugarbush-Two Inlets complex, 1 to 8 percent slopes | 775B | 20134 | 397560 | 2x14s | mn005 | 1994 | 1:20000 |
Two Inlets-Sugarbush complex, 8 to 30 percent slopes | 1238E | 11483 | 397452 | 2x14v | mn005 | 1994 | 1:20000 |
Lida-Two Inlets complex, 8 to 15 percent slopes | 1196C | 972 | 397436 | fbkj | mn005 | 1994 | 1:20000 |
Lida-Two Inlets complex, 15 to 30 percent slopes | 1196E | 598 | 397437 | fbkk | mn005 | 1994 | 1:20000 |
Lida-Two Inlets complex, 1 to 8 percent slopes | 1196B | 403 | 397435 | fbkh | mn005 | 1994 | 1:20000 |
Eagleview-Two Inlets complex, 1 to 8 percent slopes, pitted | 2018B | 2700 | 2520474 | 2qkjj | mn007 | 1991 | 1:24000 |
Sugarbush-Two Inlets complex, 3 to 15 percent slopes | 242C | 1682 | 397619 | 2x14t | mn007 | 1991 | 1:24000 |
Eagleview-Two Inlets complex, 15 to 30 percent slopes | 2018E | 946 | 2520476 | 2qkjn | mn007 | 1991 | 1:24000 |
Sugarbush-Two Inlets complex, 1 to 8 percent slopes | 242B | 411 | 397618 | 2x14s | mn007 | 1991 | 1:24000 |
Eagleview-Two Inlets complex, 8 to 15 percent slopes, pitted | 2018C | 120 | 2520475 | 2qkjk | mn007 | 1991 | 1:24000 |
Sugarbush-Two Inlets complex, 1 to 8 percent slopes | 775B | 5079 | 430589 | 2x14s | mn029 | 1993 | 1:20000 |
Sugarbush-Two Inlets complex, 3 to 15 percent slopes | 775C | 4927 | 430590 | 2x14t | mn029 | 1993 | 1:20000 |
Two Inlets-Sugarbush complex, 8 to 30 percent slopes | 1238E | 2828 | 430413 | 2x14v | mn029 | 1993 | 1:20000 |
Eagleview-Two Inlets complex, 1 to 8 percent slopes, pitted | 2018B | 281 | 2603645 | 2qkjj | mn029 | 1993 | 1:20000 |
Two Inlets-Sugarbush complex, 30 to 45 percent slopes | 1238F | 216 | 430414 | gfwb | mn029 | 1993 | 1:20000 |
Eagleview-Two Inlets complex, 15 to 30 percent slopes | 2018E | 27 | 2603646 | 2qkjn | mn029 | 1993 | 1:20000 |
Dorset-Two Inlets complex, 2 to 6 percent slopes | D5B | 171 | 451644 | h4z5 | mn053 | 2001 | 1:12000 |
Dorset-Two Inlets complex, 6 to 12 percent slopes | D5C | 68 | 451643 | h4z4 | mn053 | 2001 | 1:12000 |
Dorset-Two Inlets complex, 12 to 18 percent slopes | D5D | 31 | 451642 | h4z3 | mn053 | 2001 | 1:12000 |
Steamboat-Two Inlets-Seelyeville complex, pitted, 0 to 15 percent slopes | 526C | 65187 | 436671 | gnd5 | mn057 | 1998 | 1:24000 |
Steamboat-Two Inlets-Seelyeville complex, pitted, 0 to 35 percent slopes | 526E | 38306 | 436672 | gnd6 | mn057 | 1998 | 1:24000 |
Two Inlets-Eagleview-Steamboat complex, pitted, 3 to 15 percent slopes | 675C | 23233 | 436694 | gndx | mn057 | 1998 | 1:24000 |
Two Inlets-Eagleview-Steamboat complex, pitted, 15 to 35 percent slopes | 675E | 15750 | 436695 | gndy | mn057 | 1998 | 1:24000 |
Rockwood-Two Inlets, morainic, complex, 3 to 8 percent slopes, stony | 1421B | 15347 | 436542 | gn80 | mn057 | 1998 | 1:24000 |
Sugarbush-Two Inlets complex, 1 to 8 percent slopes | 775B | 14068 | 436720 | 2x14s | mn057 | 1998 | 1:24000 |
Sugarbush-Two Inlets complex, 3 to 15 percent slopes | 775C | 11030 | 436721 | 2x14t | mn057 | 1998 | 1:24000 |
Rockwood-Two Inlets, morainic, complex, 8 to 15 percent slopes, stony | 1421C | 9805 | 436543 | gn81 | mn057 | 1998 | 1:24000 |
Two Inlets-Sugarbush complex, 8 to 30 percent slopes | 1238E | 5933 | 436512 | 2x14v | mn057 | 1998 | 1:24000 |
Rockwood-Two Inlets, morainic, complex, 15 to 30 percent slopes, stony | 1421E | 4952 | 436544 | gn82 | mn057 | 1998 | 1:24000 |
Steamboat-Two Inlets complex, pitted, 35 to 65 percent slopes | 574G | 3486 | 436683 | gndk | mn057 | 1998 | 1:24000 |
Two Inlets-Eagleview-Steamboat complex, pitted, 35 to 65 percent slopes | 675G | 2827 | 436696 | gndz | mn057 | 1998 | 1:24000 |
Two Inlets-Sugarbush complex, 30 to 45 percent slopes | 1238F | 585 | 436513 | gn72 | mn057 | 1998 | 1:24000 |
Sugarbush-Two Inlets complex, 3 to 15 percent slopes | 775C | 2312 | 399253 | 2x14t | mn087 | 1992 | 1:20000 |
Two Inlets-Sugarbush complex, 8 to 30 percent slopes | 1238E | 1198 | 399207 | 2x14v | mn087 | 1992 | 1:20000 |
Sugarbush-Two Inlets complex, 1 to 8 percent slopes | 775B | 299 | 399252 | 2x14s | mn087 | 1992 | 1:20000 |
Lida-Two Inlets complex, 1 to 8 percent slopes | 1196B | 23059 | 435550 | gm70 | mn111 | 1996 | 1:20000 |
Lida-Two Inlets complex, 8 to 15 percent slopes | 1196C | 20861 | 435551 | gm71 | mn111 | 1996 | 1:20000 |
Lida-Two Inlets complex, 15 to 30 percent slopes | 1196E | 9329 | 435552 | gm72 | mn111 | 1996 | 1:20000 |
Lida-Two Inlets complex, 30 to 50 percent slopes | 1196F | 886 | 435553 | gm73 | mn111 | 1996 | 1:20000 |
Two Inlets loamy sand, noncalcareous substratum, 0 to 6 percent slopes | 1399B | 4393 | 394812 | f7tw | mn135 | 1999 | 1:24000 |
Dorset-Two Inlets complex, 2 to 6 percent slopes | 1377B | 15844 | 435080 | glqv | mn171 | 1998 | 1:12000 |
Dorset-Two Inlets complex, 6 to 12 percent slopes | 1377C | 6347 | 435079 | glqt | mn171 | 1998 | 1:12000 |
Lida-Two Inlets complex, 15 to 30 percent slopes | 1196E | 2770 | 435057 | glq3 | mn171 | 1998 | 1:12000 |
Dorset-Two Inlets complex, 12 to 20 percent slopes | 1377D | 1775 | 435078 | glqs | mn171 | 1998 | 1:12000 |
Dorset-Two Inlets complex, 20 to 35 percent slopes | 1377E | 1367 | 435077 | glqr | mn171 | 1998 | 1:12000 |
Lida-Two Inlets complex, 8 to 15 percent slopes | 1196C | 1323 | 435058 | glq4 | mn171 | 1998 | 1:12000 |
Lida-Two Inlets complex, 1 to 8 percent slopes | 1196B | 1194 | 435059 | glq5 | mn171 | 1998 | 1:12000 |


